Prepare the Data
Domain 1 — 25-30% of Exam
Question 01
Which Power BI component is used to connect to data sources, clean, transform, and shape data before loading it into the data model?
APower Query Editor ✅
BDAX formula bar
CReport view
DPower BI Service
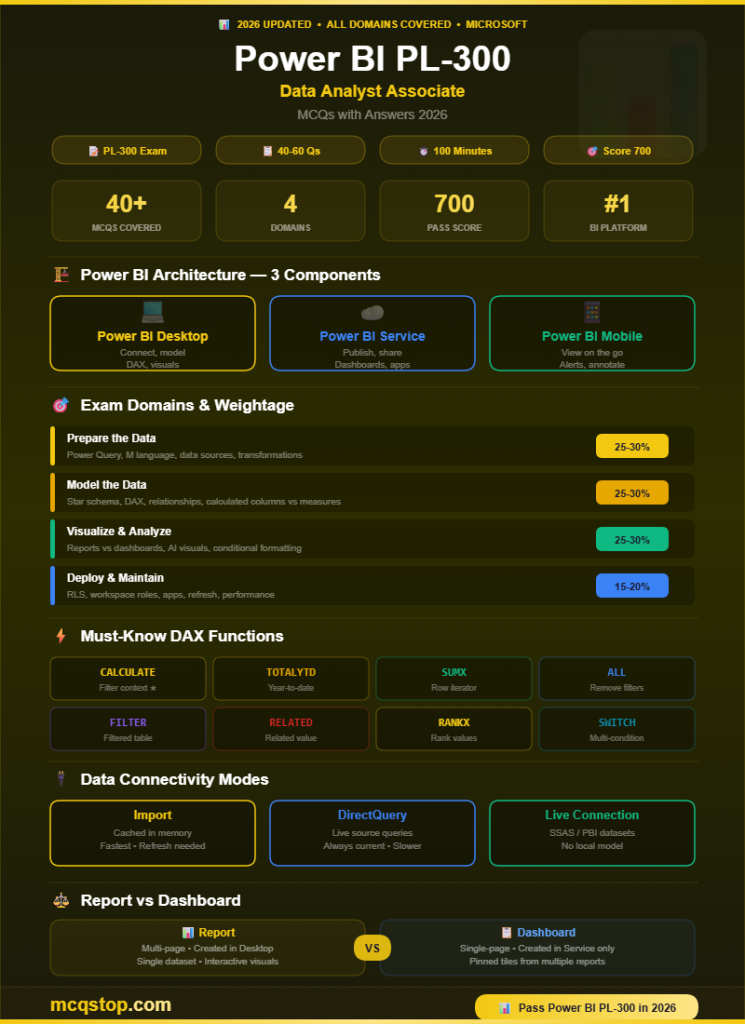
💡 Explanation: Power Query Editor is the ETL engine within Power BI Desktop. It connects to 150+ data sources (SQL, Excel, SharePoint, APIs, web pages) and provides a visual interface for cleaning and transforming data — removing columns, filtering rows, changing data types, merging queries, unpivoting, handling errors, and creating custom columns using M language. Power Query steps are recorded and applied automatically on refresh.
Question 02
A data analyst needs to combine rows from two tables that have the same structure (same columns) into a single table. Which Power Query operation should they use?
AMerge queries
BAppend queries ✅
CGroup by
DPivot column
💡 Explanation: Append stacks rows from two or more tables vertically (like SQL UNION) — both tables must have the same columns. Merge joins two tables horizontally based on a matching column (like SQL JOIN) — combining columns from both tables. Group By aggregates rows (SUM, COUNT, AVG). Pivot converts row values into columns. This Append vs Merge distinction is one of the most tested PL-300 concepts.
Question 03
Which data loading mode in Power BI stores data in memory for the fastest query performance but requires scheduled refreshes for updated data?
AImport mode ✅
BDirectQuery mode
CLive Connection
DDual mode
💡 Explanation: Import mode loads data into Power BI’s in-memory engine (VertiPaq) for the fastest performance. Data is compressed and cached locally. Drawback: data is static until refreshed (up to 8x/day on Pro, 48x on Premium). DirectQuery sends queries to the source in real-time — always current but slower. Live Connection connects to existing Analysis Services or Power BI datasets. Dual mode combines Import and DirectQuery for composite models.
2
Model the Data
Domain 2 — 25-30% of Exam
Question 04
Which data modeling schema is RECOMMENDED by Microsoft for Power BI, where a central fact table connects to surrounding dimension tables?
AStar schema ✅
BSnowflake schema
CFlat table design
DNormalized relational design
💡 Explanation: Star schema is the optimal design for Power BI. A central fact table (transactions, sales, events) connects to dimension tables (customers, products, dates) via one-to-many relationships. Benefits: simpler DAX calculations, better compression, faster queries, and easier-to-understand models. Snowflake schema normalizes dimensions (dimensions link to sub-dimensions) — this adds complexity and is not recommended for Power BI.
Question 05
Which DAX function calculates a running total — for example, the cumulative sum of sales from the beginning of the year through the current date?
ASUM()
BTOTALYTD() ✅
CAVERAGE()
DRANKX()
💡 Explanation: TOTALYTD() calculates a year-to-date running total. Syntax: TOTALYTD(SUM(Sales[Amount]), Dates[Date]). Related time intelligence functions: TOTALQTD() (quarter-to-date), TOTALMTD() (month-to-date), SAMEPERIODLASTYEAR() (compare to prior year), DATEADD() (shift dates). Time intelligence requires a proper date table marked as a date table. DAX is heavily tested on PL-300.
Question 06
What is the difference between a DAX calculated column and a DAX measure in Power BI?
AA calculated column is computed row-by-row and stored in the model; a measure is computed dynamically at query time based on filter context ✅
BThey are identical in functionality
CMeasures are stored in the model; calculated columns are computed dynamically
DCalculated columns can only use M language
💡 Explanation: Calculated columns are evaluated row-by-row during data refresh and stored physically in the model (increases file size). They work in row context. Measures are evaluated dynamically at query time based on the current filter context — they are NOT stored. Best practice: use measures for aggregations (SUM, AVERAGE, COUNT) and calculated columns only when you need a value per row (for slicing, sorting, or relationships).
Question 07
Which DAX function overrides the existing filter context to evaluate an expression with a new filter applied?
ACALCULATE() ✅
BFILTER()
CSUMX()
DALL()
💡 Explanation: CALCULATE() is the most important and most tested DAX function. It evaluates an expression in a modified filter context. Example: CALCULATE(SUM(Sales[Amount]), Product[Category] = "Electronics") returns the sum of sales for Electronics only, regardless of any other slicer selections. FILTER() returns a table, SUMX() iterates row-by-row, ALL() removes all filters. Master CALCULATE for PL-300.
3
Visualize & Analyze the Data
Domain 3 — 25-30% of Exam
Question 08
What is the difference between a Power BI report and a Power BI dashboard?
AReports are multi-page with interactive visuals created in Desktop; dashboards are single-page canvases of pinned tiles from multiple reports, available only in Service ✅
BThey are identical features with different names
CDashboards are created in Desktop; reports are created in Service
DReports show real-time data; dashboards show historical data
💡 Explanation: Reports are multi-page, interactive documents created in Power BI Desktop using data from a single dataset. Dashboards are single-page overviews in Power BI Service that display pinned visuals (tiles) from one or MORE reports. Dashboards cannot be created in Desktop — only in Service. Clicking a dashboard tile opens the underlying report. This distinction is heavily tested and frequently confused.
Question 09
A stakeholder wants to understand WHY sales dropped in a specific region. Which Power BI AI feature can automatically analyze data to identify factors that influenced the change?
AQuick Insights
BKey Influencers visual ✅
CDecomposition Tree
DScatter chart
💡 Explanation: The Key Influencers visual uses AI/ML to identify which factors most significantly influence a metric. It shows what increases or decreases the analyzed value and by how much. The Decomposition Tree allows interactive drill-down into contributing factors. Q&A lets users ask natural language questions. Smart Narratives auto-generate text summaries. Know all Power BI AI visuals for the exam.
Question 10
Which Power BI feature allows users to apply formatting rules that change the color of cells, bars, or icons in a visual based on the data values — like turning negative values red?
AConditional formatting ✅
BThemes
CBookmarks
DDrill-through
💡 Explanation: Conditional formatting applies dynamic formatting based on data values — background color, font color, data bars, icons, and web URLs. Options include: color scales (gradient based on values), rules (if value > X then green), and field values (use a DAX measure to determine colors). Themes apply consistent branding. Bookmarks save view states. Drill-through navigates to a detail page when clicking a data point.
4
Deploy & Maintain Assets
Domain 4 — 15-20% of Exam
Question 11
Which Power BI Service feature restricts data visibility so that users only see data relevant to their role — for example, a regional manager only sees their region’s data?
ARow-Level Security (RLS) ✅
BWorkspace roles
CPage-level filters
DSensitivity labels
💡 Explanation: Row-Level Security (RLS) filters data at the row level based on DAX filter expressions applied to security roles. You create roles in Power BI Desktop with DAX filters (e.g., [Region] = USERPRINCIPALNAME()) and assign users to roles in Power BI Service. RLS ensures users only see authorized data — critical for multi-tenant and regional reports. Workspace roles control access to the workspace itself, not the data.
Question 12
What are the four workspace roles in Power BI Service, from most permissions to least?
AAdmin → Member → Contributor → Viewer ✅
BOwner → Editor → Reader → Guest
CCreator → Publisher → Consumer → Auditor
DManager → Developer → Analyst → User
💡 Explanation: Power BI workspace roles: Admin (full control, manage users, delete workspace), Member (publish content, manage access except Admin), Contributor (create/edit content, cannot manage access or publish apps), Viewer (view and interact with content only). Apps are distributed to broader audiences from workspaces. Know what each role can and cannot do — this is frequently tested on PL-300.
Question 13
How should a data analyst share a collection of reports and dashboards with a large group of business users who should only be able to view (not edit) the content?
APublish a Power BI App from the workspace ✅
BAdd all users as workspace Members
CEmail them the .pbix file
DExport to PDF and share via SharePoint
💡 Explanation: Power BI Apps package a curated collection of reports and dashboards for distribution to broad audiences. Apps provide a read-only experience — users can interact with visuals but not modify them. Apps are published from workspaces and can be distributed to the entire organization or specific security groups. Adding users as Members would give them edit access. Exporting to PDF loses interactivity.
Question 14
An analyst’s Power BI report is loading slowly. Which performance optimization technique should they try FIRST?
AUse Performance Analyzer to identify slow visuals and DAX queries, then optimize ✅
BSwitch all data to DirectQuery mode
CAdd more visuals to the page
DIncrease the dataset size
💡 Explanation: Performance Analyzer (View tab → Performance Analyzer) records and displays the execution time for each visual, DAX query, and render operation. It identifies bottlenecks so you can optimize targeted areas. Common optimizations: reduce visual count per page, simplify DAX measures, remove unnecessary columns in Power Query, use Import mode over DirectQuery, and aggregate data where possible. DirectQuery is actually slower than Import.
How hard is the PL-300 exam? PL-300 is considered a moderately difficult exam. It has 40-60 questions (multiple choice, case studies, drag-and-drop) with a 100-minute time limit and a 700/1000 passing score. It tests hands-on Power BI skills including DAX formulas, Power Query M code, data modeling, and report design. Most candidates need 2-3 months of preparation with real Power BI experience.
Do I need PL-900 before PL-300? No — PL-900 (Power Platform Fundamentals) is not a prerequisite for PL-300. However, PL-900 provides a helpful overview of the Power Platform ecosystem. If you already have Power BI experience, skip directly to PL-300. Microsoft recommends familiarity with Power BI Desktop, Power Query, DAX, and data modeling before attempting PL-300.
Is PL-300 worth it in 2026? Absolutely — Power BI is the #1 business intelligence platform globally (Gartner Magic Quadrant leader for 16+ consecutive years). Certified Power BI analysts earn $80,000-$130,000 in the US. PL-300 is the only Power BI-specific certification and is increasingly required for data analyst and BI developer roles. It also complements SQL, Python, and data analytics skills.
Does PL-300 expire? Yes — Microsoft role-based certifications are valid for 1 year. To renew, complete a free online renewal assessment on Microsoft Learn before expiration. The renewal is shorter, open-book, and can be retaken. PL-300 earns the “Microsoft Certified: Power BI Data Analyst Associate” credential.


Leave a Comment